Linux seems to have a lack of tools for measuring disk performance, especially recording transfer speed. For analyzing bottlenecks on one of my servers I needed exactly that, so I developed a simple solution.
For the impatient: The disk utilities can be found here.
There are three utilities available, which are in short:
- test_diskread.py – Quick-display and record the I/O speed of your disk
- iograph.py – Display I/O data recorded by the tool “iostat”
- mon_iostat.py – Monitor values from “iostat” and report/log if something went wrong
The utilities are not perfect, especially (2) and (3) will need some hacking in case you want to monitor other values than the ones preconfigured.
The story (and use case) behind the above utilities
On one of my servers (a guest operating system on a KVM host, host running Linux 2.6.36), I noticed strange hangs during operation, where a simple “ls” would take up to seconds to complete. This problem was not easy to reproduce, it would somtimes come and then go away. To give you some insight, these are the specs of my system:
- Mainboard: Asus Z8NR-D12 with two Xeon Processors
- 2* Western Digital VelociRaptor, 300GB, combined in a RAID1
- 4* Western Digital Caviar Green (WD15EADS), 1500GB, combined in two seperate RAID1’s
After some testing and considerations it was clear that the problem was disk-I/O related, so I needed some kind of Linux tools to measure disk performance. After doing some searching, I found the following:
- Bonnie – An I/O throughput benchmark
- Bonnie++ – An ehanced version of the above
- Iozone – A filesystem benchmark tool
Although these tools seem reasonably well for performance measuring, I needed something else:
- Continuous performance measuring, where I can see disk-I/O problems right away
- Support for creating graphs of the disk-I/O over a long period of time
- Measuring very specific things, such as the average I/O wait and the like
- Filesystem performance not interesting
For that reason, I first came up with the tool test_diskread.py. This is a quite simple python script that does nothing more than read from a given device and output the results in a graphical way directly on the console:
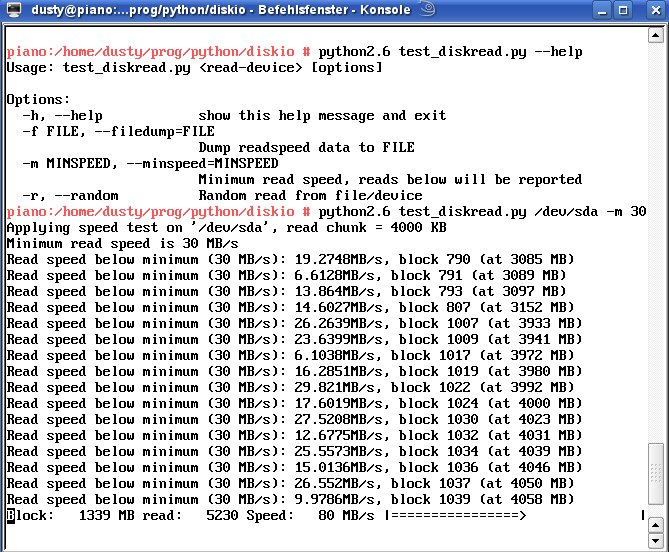
The last line shows the current speed, whereas the arrow gives a rough graphical representation. Above, one can see if the speed went below a specified value given on the command line.
Although this gives a current impression on the IO status, it is sometimes necessary to graphically depict the I/O performance over a longer period of time, lets say over half a day, or for a time period long enough so that the whole disk is read. For this reason, the script can be called with the parameter “-f”, e.g. “-f speed.dat”, which simply logs the current read speed into a file.
This script may then run in the background, later on it can be easily plotted via gnuplot like this:
hermann@piano:~/> gnuplot
gnuplot> plot "speed.dat"
The result of this will look similar to the picture below:
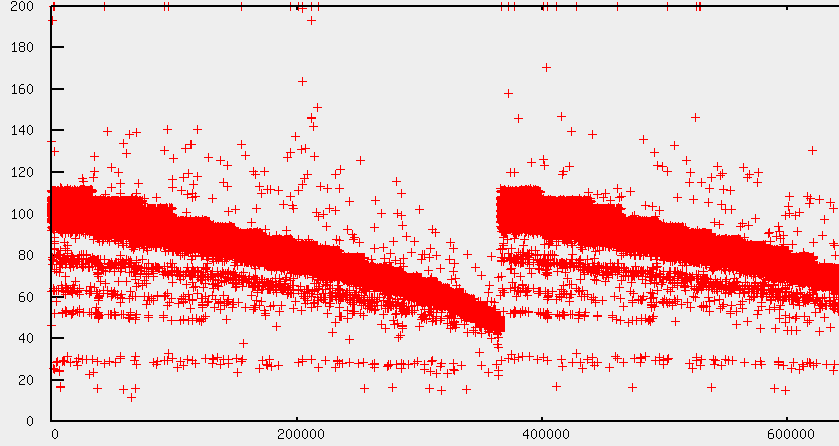
One can nicely see the transfer rates and the speed degration at the end of the disk. When the disk is at the end, the read sequence starts at the beginning again.
When testing all my harddisks, I noticed the following diagram on /dev/sde:
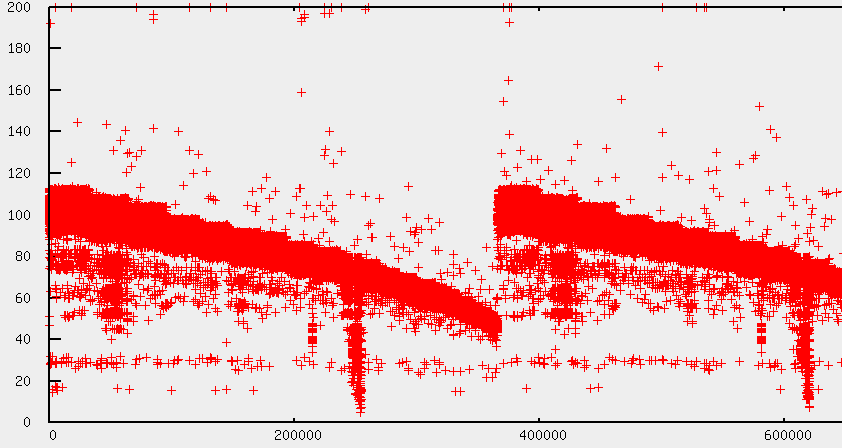
When looking at the output of S.M.A.R.T (smartctl -a /dev/sde), I found the following:
197 Current_Pending_Sector 0x0032 199 199 000 Old_age Always - 273
So obviously, there are bad sectors on this platter, which resulted in the above picture. However, that was not the reason for my original problem. Even worse, during these read tests, no performance degradation or I/O hangs could be found, so it seemed that the problem never occurred at full load, but only during idle times.
After suspecting KVM, posting to the KVM and LKML mailing list, I replaced the mainboard as the problem seemed not to be related to a specific disk: When the I/O hangs occurred, the performance was degraded on multiple disks, so I suspected that the problem was related to the SATA controller. However, with the new mainboard (Intel 5520-HC), the problem changed, in a way that other disks were not affected. For that reason I began to suspect the harddisk again, whereas an I/O hang may have led to congestions in the Primary SATA channel in the Asus motherboard, which was the reason for bad I/O performance in other disks.
After some searching on the internet, I got to the following article:
WD15EADS-00P8B0 Really slow? Or am I just crazy?
Moreover, I noticed the following S.M.A.R.T values in two of my disks, which indicate that the harddisk head goes into parking position approx. every 5 seconds:
193 Load_Cycle_Count 0x0032 019 019 000 Old_age Always - 544417
193 Load_Cycle_Count 0x0032 148 148 000 Old_age Always - 156549
Well, as I had 4 harddisks of the type WD15EADS-00P8B0 and my problems were very similar, this looked like a good reason. However, before changing the disks, I wanted proof, so I needed to monitor the disk performance during idle time.
Linux fortunately provides some tools for monitoring I/O activity, especially iotop and iostat. Iotop comes very handy as it displays the current I/O load on the system in a manner similar to the famous “top” command. Iostat on the other hand measures more values than iotop and can be used to look at details of the disk I/O system, as can be seen here:
gaia:~# iostat -t -c -d 2 -x -m sda
Linux 2.6.36-custom (gaia) 31/01/11 _x86_64_

Time: 16:45:42
avg-cpu: %user %nice %system %iowait %steal %idle
0.30 0.00 0.24 0.62 0.00 98.83

Device: rrqm/s wrqm/s r/s w/s rMB/s wMB/s avgrq-sz avgqu-sz await svctm %util
sda 1.13 0.25 3.08 5.86 0.20 0.07 60.83 0.04 4.43 0.97 0.87

Time: 16:45:44
avg-cpu: %user %nice %system %iowait %steal %idle
0.19 0.00 0.13 0.00 0.00 99.68

Device: rrqm/s wrqm/s r/s w/s rMB/s wMB/s avgrq-sz avgqu-sz await svctm %util
sda 0.00 0.00 0.00 0.50 0.00 0.00 8.00 0.01 12.00 12.00 0.60
With iostat one can easily log the current I/O status into a file. What’s missing, however, was a tool to graphically display the details of single values, so this was something I had to develop. What was particulary interesting to me was the await value, as this indicates the average wait time in milliseconds for the response of the harddisk. If my theory was right, the “await” value should be very high, up to some seconds.
So, what I came up with was a simple Python script, called iograph.py. This script is a bit hacked together and also uses the Gnuplot library, so in case you want to use it, you will have to install the Python Gnuplot library and maybe hack a bit in the script itself. Then I monitored the I/O with a simple command like this:
iostat -t -c -d 2 -x -m sda sdb sdc sdd sde sdf > iostat.dat &
After some time, I experienced disk I/O stucks again and therefore feeded the monitored data into my script, with the following results:
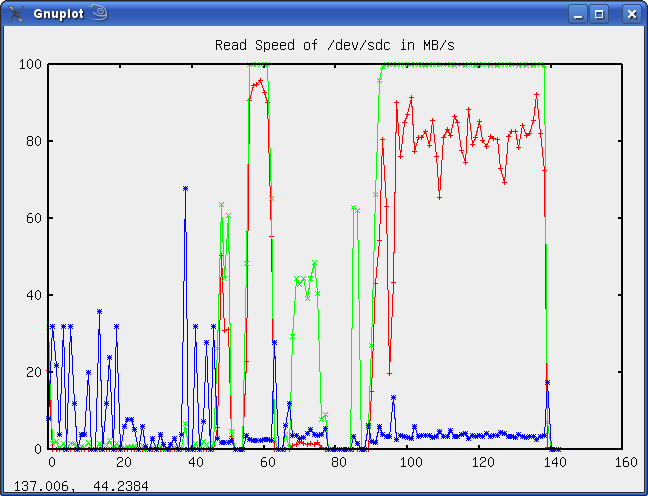
The above picture was the monitored data of /dev/sdc, whereas the lines mean the following:
- Blue: The await times in milliseconds
- Red: The current transfer rate in Megabytes/seconds
- Green: The CPU utilization in percent
Everything seems o.k. here, the await time is lower than 50ms, which is reasonable. One can see that I started to read from the disk after approx. 1/3rd of the diagram, which was fine, too.
The above diagram illustrates the same values for /dev/sdc. It can be seen that the average wait times are up to 5 seconds, which proofs my theory, thus the drive is defective.
As I experienced the problem on /dev/sdc at another time, too, it seems that the WD15EADS has some bug, that may have to do with the Load_Cycle_Count. It may be that after a specific amount of placing the head in the parking posistion, it has problems to “unpark” it, which results in these high wait times. Anyways, I sent back all 4 harddrives as they were in warranty and got 4 models with a later production date. For now it seems that the problem is gone. Moreover, Western Digital provides a simple DOS tool which can be used to shut off the harddisk head parking, so the Load_Cycle_Count stays low now.
To check that the problem does not occur again, I wrote another little script called mon_iostat.py that can be used to continuously monitor I/O values and log in case some value (such as the average wait time) is exceeded. This script can be called like this but may need some hacking in case you want to monitor other values than average wait:
iostat -t -c -d 2 -x -m sda sdb sdc sdd sde sdf | python mon_iostat.py > await.log
For now, the problem seems to be gone as no error is logged so it seems the problem is solved permanently.
By the way, all the scripts can be found at this location. They are far from perfect but may proof a good entry point for measuring and monitoring your harddisk performance.